“But I don’t even know how to draw” you might say. Well, I only draw stick figures. But! If you want an awesome overview of how to do basic drawings, I’m fond of David Gray’s.
Workshop Video
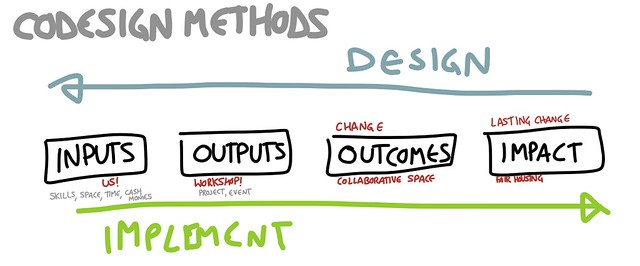
And overview on the Codesign Toolkit website.
Approach/Types
Thinking about how to lay things out is a key part of vizthink. In the workshop format, this is where I ask people to put each idea component onto one post-it note, and then arrange the sticky notes in various ways.
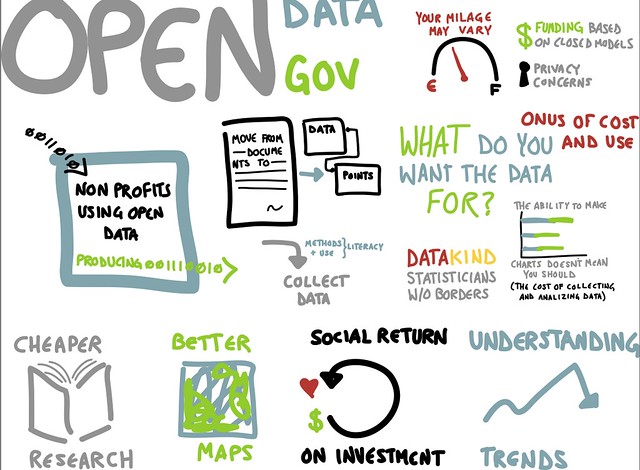
Charts!
At its most basic, visual thinking is a way to show workflow and charts. Rather than explaining in lengthy and complicating words, a drawing can often demonstrate relationships and interactions between components.
Charts can be serious and examining:
Or they can be silly and humorous:

Individual Ideas
Often, when people are speaking or beginning to flesh out an idea, it makes sense to draw the individual components or speaking points as just that – individual parts. Using Adobe Ideas on my iPad, I do one layer per point. Often, these just end up as a collection of strangely-shaped references to ideas, which can then be arranged (remember, different layers!) to look nice nested within each other. This is, I suppose, a form of graphic design.
If there are enough components, or enough detail, it’s worth embedding into a prezi and defining a path for the viewer.
De-conflating Ideas
It also helps to de-complicate what is a part of a workflow, what isn’t, and where confusion is coming in. This is the part of the conversation or explanation where we start gesticulating or arranging things on the table to demonstrate a point.
For instance, I was frustrated that a bunch of digital disaster response groups wanted to list all the other projects that were going on for a certain topic (in this case, Hurricane Sandy). This is bulky because then there are many places to update if a project changes, completes, or dies. After spending 40+ lines of text in chat trying to explain what I meant, drawing this picture helped much more.
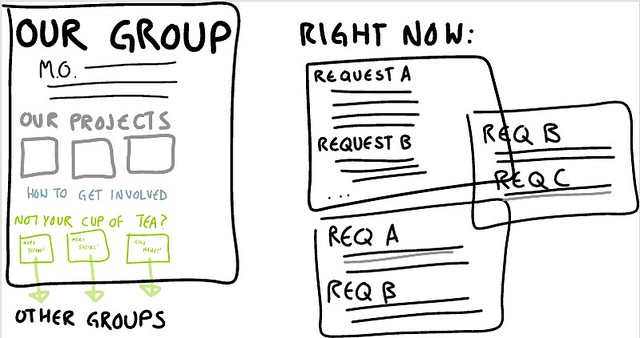
One reason the internet is amazing is because of the ability to point sections of a webpage at other webpages (RSS FTW). Not doing that was over complicating matters, but trying to differentiate via text rather than in a drawing just wasn’t working.
Building a Story
Now that you’re able to deconflate ideas as well as delineate them, it makes sense to move on to how components of a story interact with each other. Rather than moving from node to node, this method takes layers in Adobe Ideas and stacks them on top of one another. In this way, you can start to see how ideas flow into each other, and how they interact.
System Interaction
Life isn’t linear, and at times it is difficult to express all the moving parts while not losing the trees for the forest. While all models are incomplete (but they can still be useful), having a drawing can acknowledge the boundaries of a systems model while not dwelling on those limitations.
Similar to storytelling and individual nodes, we still see the individual components. However, in a System Interaction drawing, we see how those components play off of each other, and see where leverage points might be.
Tools
You can do this with paper or a wall or a napkin and paint or markers or pencils or whatever you want! I work digitally, and so here’s my toolkit:
Tablet
Many people who do graphic facilitation use huge sheets of paper. I have a great deal of admiration for them, because I’m not that good yet! In order to layer, adapt, and correct spelling mistakes, I prefer the digital format. I also like how portable, streamable, and sharable the digital format is. After playing with a Surface and an Android tablet, I still use an iPad – the least laggy for the tools I use. Always be sure it’s charged up and backed up, yada yada.
Stylus
I used to use my finger, but I find a stylus helps both in natural movement, detail, and not having dirty screen. There are tons of styluses you can get from Radio Shack, or the Apple store, or whatever, but I use an electrostatic sock over a chopstick from this dude on Etsy.
Adobe Ideas
I use Adobe Ideas is what I draw in. It provides many useful components while not being so overwhelming as to be ungainly, nor difficult for new users. Graphics are vector, though the canvas isn’t quite infinite. It exports as PDF, which can be surprisingly versatile once you get ahold of them. And, it imports nicely into Prezi.
Prezi
Prezi is what a lot of this work goes into. It lets me guide the way people move through notes – nested ideas, Easter eggs, and all. That is probably a tutorial in and of itself, but here is something about how my brain works around it.
The play between an semi-infinite canvas, vector graphics, and visual layout really shines in Prezi. You can show a non-linear story while also providing a way for people see the whole system at once. It’s also great for embedding far more content than you cover in a talk, and letting people go in later to explore for themselves.
AirServer + ScreenFlow
I find it’s super fun to record the process of drawing itself. I do this by having both my laptop and iPad on the same network, and then loading up AirServer. This allows what I’m doing on my iPad to be mirrored on my laptop. Which means I can use ScreenFlow to record that mirroring (plus any audio). When played back at a faster rate, a visual story unfolds along with the talk, like what I did for Galway’s Ignite:.
In this, you can see the editing software I’m using, which is also the same as the screen capture.
Advanced
Now that I can record the process of drawing, it’s even more fun to show ideas develop through the process itself, rather than just the completed ideas overlaying each other.
And taken an already-done talk, drawn it, and synced back to the audio:
Collaboration
The next bit that I’m super interested in exploring is that of how to collaborate together in drawing. I’m looking forward to the next unconference I get to go to where others are willing to play with me in this space. Whether in physical space on pieces of butcher paper, or in the collaborative editing capabilities of Prezi, I can’t wait to further explore this space.
Cohort and fellow Berkmanite Primavera showed me the Kopfschlag project, a persistent, collaborative, online drawing tool. You can play at the link, but here’s a time-lapse:
Kopfschlag from kopfschlag on Vimeo.
In the same way people have taken quickly to collaborative document editing, I see those of us who are visual thinkers sharing drawing space to express ideas in new ways.